
Pekka Rinne has been able to play the best hockey of his career so far this season. Seriously, Rinne’s numbers right now are the best in his career, outperforming his previous career best 5on5 save percentage from 2010-11 by almost a full percentage point. There is virtually no way he can sustain this for an entire season.
As I wrote about recently, the Predators are playing well, but their 5on5 PDO indicates luck is also on their side. The good news is their possession stats are here to stay. Unfortunately, Rinne’s incredible performance so far has been a contributing factor to the high PDO. It’s not impossible for Rinne to keep these numbers going for the next few weeks, months, or even the rest of the season. Last season, Semyon Varlamov helped carry the Avalanche to the playoffs due to his .935 5on5 save percentage. The season before, Corey Crawford led the Blackhawks to the President’s Trophy and Stanley Cup riding a red hot .932 5on5 save percentage. It’s not unheard of for a goalie to play above their career numbers for an entire season, but Rinne’s are so far beyond what we would expect.
We don’t know a goalie’s true talent until he faces about 3,000-5,000 even strength shots. Once he has faced that many shots, his career save percentage tends to be the best predictor for what his true talent level is (obviously age factors into goalie predictions, but because Rinne isn’t at that point yet, I’m going to disregard that for now). To date, Rinne has faced over 7,400 even strength shots so we can be pretty safe assuming his career all situations save percentage of .919 and 5on5 save percentage of .927 are both indicative of his true talent level. Both are very good numbers, but Rinne currently has an all situations save percentage of .932 and a 5on5 save percentage of .946 through 21 games this season.
The Predators are not in trouble if Rinne regresses back to his career numbers though. The table below shows the goal totals so far that Rinne has allowed and what should be expected based on his career numbers. It should be stated that we are using Rinne’s career numbers as a reference. There’s no telling what his save percentage will actually finish at or regress to. What we can say for sure, though, is that he will regress from where he is at.**
| Career Sv% | 2014-15 Sv% | 2014-15 Expected Goals Against | 2014-15 Actual Goals Against | |
| 5on5 | .927 | .946 | 36 Goals Against | 25 Goals Against |
| All Situations | .919 | .932 | 51 Goals Against | 39 Goals Against |
So far, Rinne has allowed 11 goals fewer than expected at 5on5 and 12 goals fewer for all situations. Eric T. over at Broad Street Hockey calculated that about 6 goals equates to one win. Using that logic, Rinne has improved the Predators record by about 2 wins compared to his career play; a huge increase over only 21 games. What do these numbers translate to if Rinne and the Predators continue this play for the entire season, however unlikely that may be?
Rinne averages 62 games played over a full season. We can then compare two different outcomes over 62 games for Rinne. The first one will use only his career numbers. The second outcome will use only numbers from this season. Both projections use Rinne’s current shots against totals from this season of 22 shots against at 5on5 per game and 27 shots against at all situations.
| Career Sv% | 2014-15 Sv% |
Career Expected Goals Against Over 62 Games |
2014-15 Expected Goals Against Over 62 Games |
|
| 5on5 | .927 | .946 | 100 | 73 |
| All Situations | .919 | .932 | 137 | 115 |
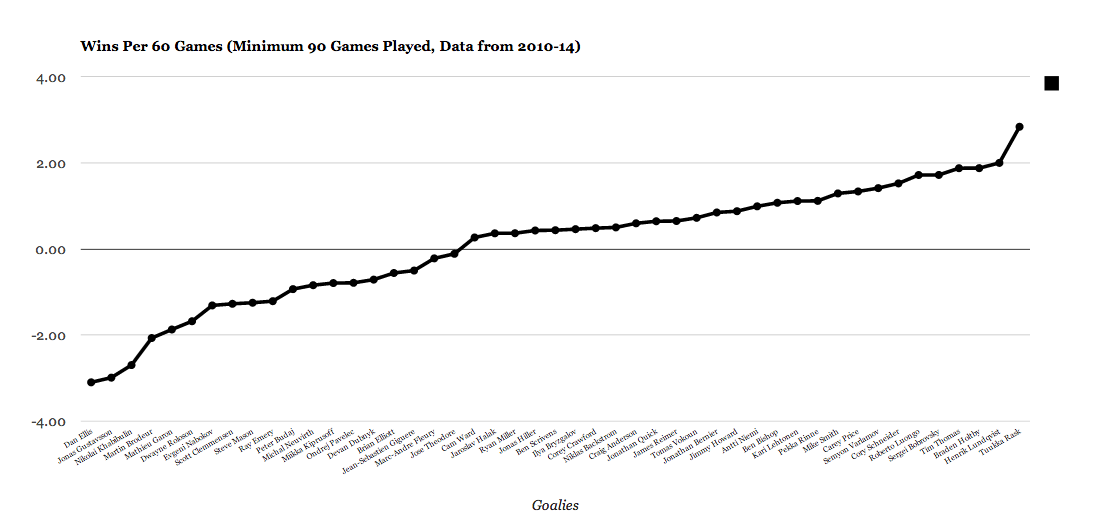
Rinne will be 27 goals against better at all situations if he continues this pace for the entire season. He would also be an incredible 34 goals better at 5on5. That would give the Predators 4-5 more wins on the season over using an “average Pekka Rinne”. Rinne is already about 1 win better than the league-average goaltender over 60 games. Adding 5 wins to that would easily make him the best goalie in the league, far surpassing elites Henrik Lundqvist and Tuukka Rask. Rask’s best year included a 5on5 save percentage of .942. It will be almost impossible for Rinne to put up numbers beyond that for an entire season.
When it comes down to it, Rinne cannot sustain his current play, but the inevitable regression is not as haunting as it seems. The difference between “Super Pekka” and “Average Pekka” is only 4-5 wins per season. Remember they already have 2 of those extra wins, and with a Score-Adjusted Fenwick of 54.5%, Nashville is top 5 in the league in possession and poised to make a run to win the division with or without those 3 remaining extra wins. Rinne, average or super, is a good thing for the Predators.
*All goalie numbers come from War On Ice. Score-Adjusted Fenwick comes from Puck On Net.
**A previous version incorrectly stated Rinne had faced over 7800 shots at 5on5, when the real number is 7426. Further, the statements “It should be stated that we are using Rinne’s career numbers as a reference. There’s no telling what his save percentage will actually finish at or regress to. What we can say for sure, though, is that he will regress from where he is at. ” were added after the post was published due to the author feeling this needed to be added.